1) Constant relative risk
This example concerns a family with a rare connective tissue disorder, where a rare autosomal variant was found. The case primarily focuses on accounting for unaffected carriers who are relatively young compared to the expected onset of the disease.
Pedigree table
The data corresponding to the case is shown below:
 ped id fid mid sex phenotype carrier proband age
   1  1   0   0   1         .       .       .  80
   1  2   0   0   2         .       .       .  80
   1  3   1   2   1    nonaff       .       .  40
   1  4   0   0   2    nonaff       .       .  80
   1  5   1   2   1  affected     het       .  60
   1  6   0   0   2    nonaff       .       .  80
   1  7   3   4   1    nonaff     neg       .  60
   1  8   3   4   1  affected     het       .  50
   1  9   0   0   2    nonaff       .       .  60
   1 10   5   6   1  affected     het       .  30
   1 11   0   0   2    nonaff       .       .  50
   1 12   5   6   1    nonaff     neg       .  50
   1 13   8   9   2  affected     het       1  30
   1 14   8   9   2    nonaff     neg       .  30
   1 15   8   9   1    nonaff     het       .  30
   1 16  10  11   1    nonaff     het       .  30
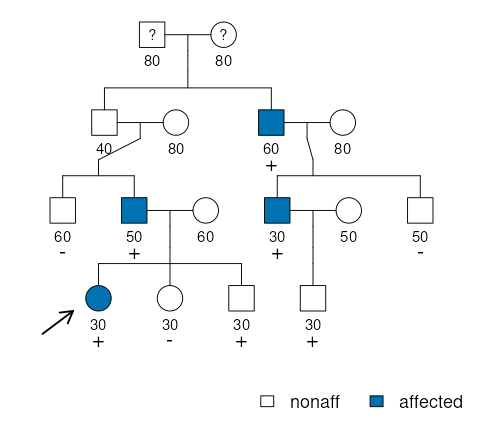
In brief, there are four affected family members with disease onset occurring between the ages of 30 and 60 years, all of whom are carriers. Additionally, five unaffected individuals have been tested, revealing that two individuals from the youngest generation (aged 30 years) are carriers. Moreover, the proband’s grandfather is likely an obligate carrier, although he remained asymptomatic until his death in his 40s.
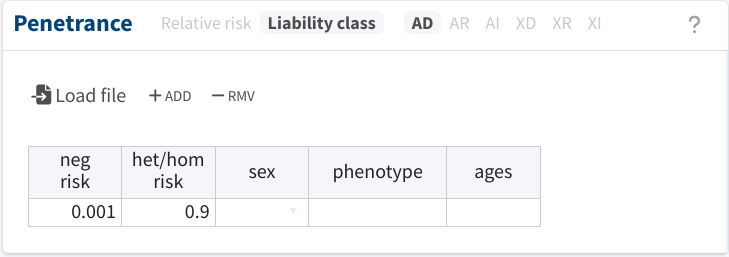
A single liability class
The simplest way to analyze these data is to consider a single risk
parameter for noncarriers (phenocopy rate) and another for carriers
(penetrance). This can be achieved by switching the mode to
Liability class and then specifying a single liability class, which
will apply to all cases regardless of phenotype, sex, and age. For
example, the following will set a phenocopy rate of 0.001 and a
penetrance of 0.90, which may be viewed as somewhat conservative values.
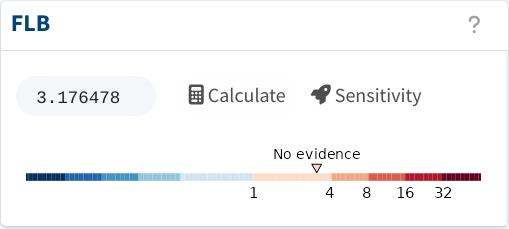
After completing these steps, the FLB panel becomes available. Upon
clicking on Calculate, a value of FLB = 3.2 is generated,
indicating inconclusive evidence regarding the variant’s pathogenicity
(FLB < 8).
Now, let’s conduct a sensitivity analysis to assess the robustness of
this result. Click on Sensitivity and select het/hom risk
(penetrance) as the first parameter and neg risk (phenocopy rate) as
the second. Adjust the ranges of values to test to 0.5–0.9999 and
0.0001–0.10, respectively, and then click on Plot.
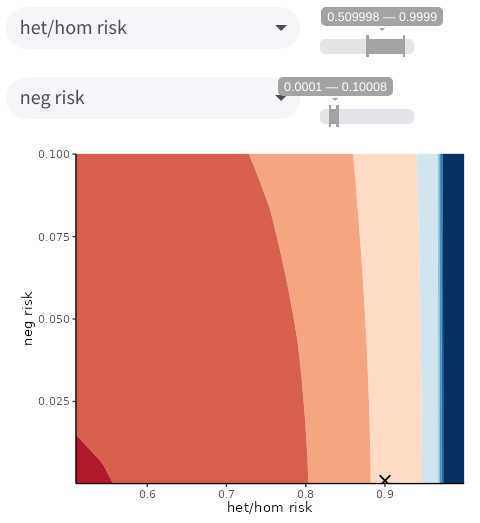
We can observe that reducing the carriers’ risk enhances the evidence, primarily due to the presence of the unaffected carriers. However, we know that in this case these carriers are also young. Accounting for this fact may significantly increase the FLB value.
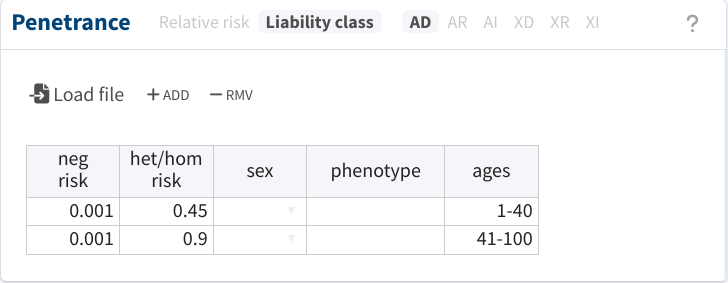
More liability classes
The easiest method to achieve this is by adding more liability classes. This can be done by clicking on ADD and completing the new rows in the liability class table. For instance, the following configuration specifies that the penetrance in individuals aged 1-40 will be 0.45, which is half the value for the older individuals.
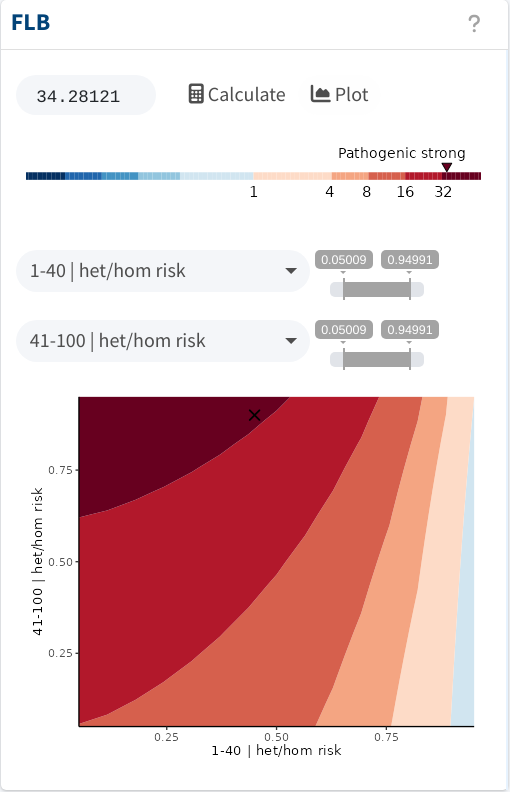
With this simple adjustment, the FLB jumps to FLB = 34.3, indicating
strong evidence for pathogenicity (FLB > 32). However, conducting a
sensitivity analysis by comparing the penetrances in the young
(1-40 | het/hom risk) and old (41-100 | het/hom risk) age groups
reveals that this result is not robust.
Different conclusions may arise if we implement a more detailed age group classification. Nevertheless, doing so makes sensitivity analyses increasingly cumbersome, as each new liability class introduces two additional parameters.
Relative risk mode
Alternatively, we can revert to the default Relative risk mode. This
mode simplifies the specification of age-specific penetrances while
ensuring that modeling assumptions remain transparent and manageable
within a reasonable number of parameters.
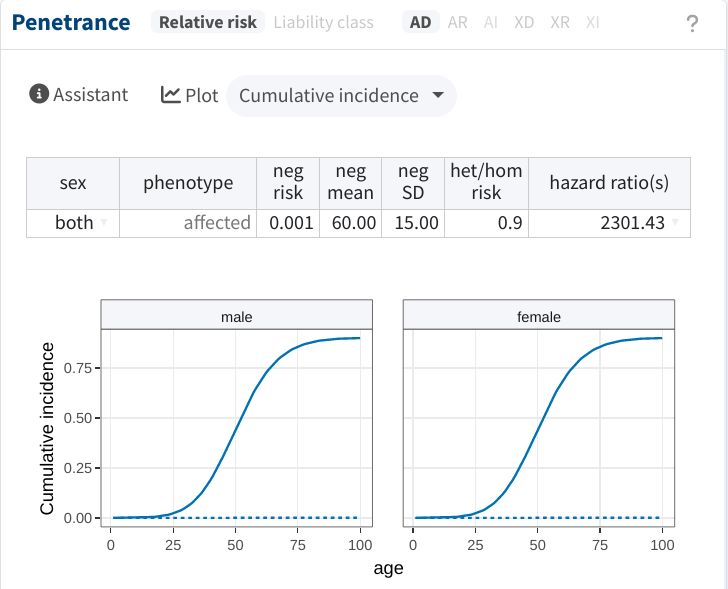
For instance, in the following model, we define lifetime risks of 0.001
for non-carriers (neg risk) and 0.90 for carriers (het/hom risk).
Additionally, we specify that phenocopies have an age of onset around
60±15 years of age (neg mean and neg SD). The last parameter,
hazard ratio(s), is automatically updated by the app. Since it
contains a single value, it implies that we are assuming a constant
relative risk model. The plots below illustrate how these inputs
translate to the expected cumulative incidences in carriers (solid
lines) and non-carriers (dashed lines) of the variant.
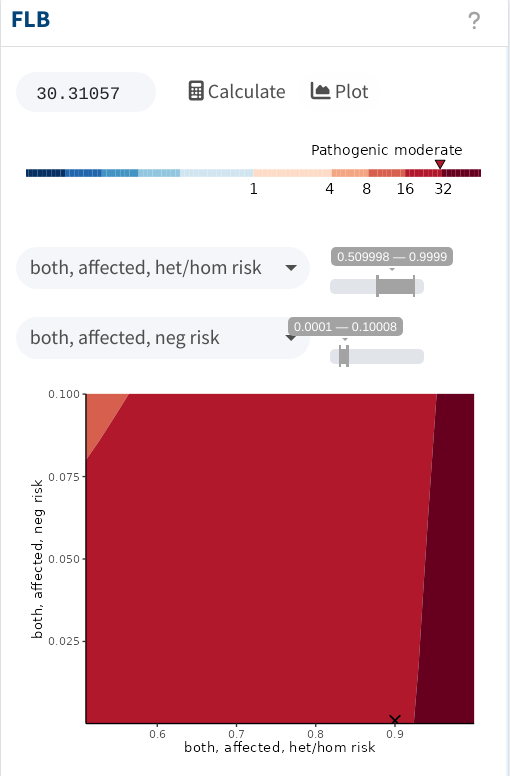
With the updated parameters, we now obtain an FLB score of FLB = 30.3,
indicating moderate evidence for pathogenicity (FLB > 16). Conducting
a sensitivity analysis comparing both lifetime risks demonstrates that
this conclusion is robust.