FLB and sensitivity
Once all the essential data is in place, shinyseg will let you compute the cosegregation evidence using the FLB panel.
Before computing the cosegregation evidence, ensure that you have adjusted the frequency of the rare variant in the population. By default, it is set to 0.001 (equivalent to 0.1%). You can find this input in the upper right corner, next to the notification menu.
FLB calculation
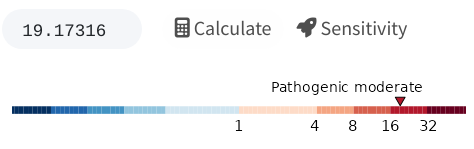
Click on Calculate to compute the full-likelihood Bayes factor (FLB)
for the analysis, as described by Thompson et
al. (2003). If successful, a numerical
value will appear and be mapped to a colored key, as shown below. You
may use this key to interpret the cosegregation evidence within the
ACMG-AMP framework, following the thresholds outlined by Jarvik and
Browning (2016). For
example, in this single-family analysis with FLB = 19.2, the app will
indicate that there is moderate evidence for the variant’s
pathogenicity.
Calculations may occasionally fail due to numerical issues in penetrance computation, Mendelian errors in the pedigree, or other inconsistencies between penetrance and pedigree (e.g., two unaffected parents cannot have an affected child under a complete penetrance model). If you encounter difficulties identifying the cause, please don’t hesitate to contact us for assistance!
Sensitivity analyses
Afterward, you can click on Sensitivity to conduct sensitivity analyses. This feature enables systematic testing of the FLB’s robustness by varying the values of the analysis parameters. #1 Constant relative risk provides a good example of why this may be relevant.
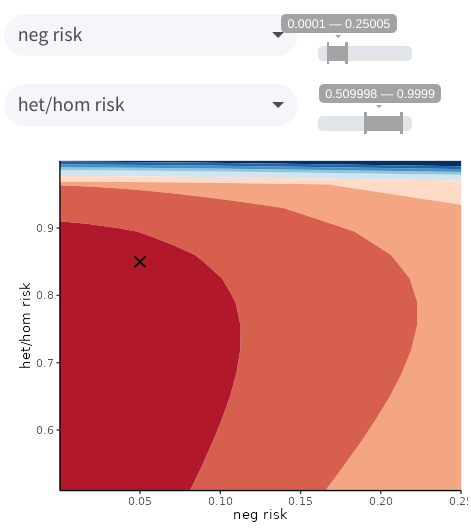
To proceed, select two analysis parameters from the dropdown inputs —
the choices will depend on all previous inputs and are presented as a
list of sex-age-phenotype-parameter combinations. Then, specify a range
of values to test for each one, and click on Plot. A contour plot
will appear displaying the FLB as a function of the selected parameters,
using the same colors as the key provided earlier. If your current
parameter values are within the specified ranges, they will also be
displayed as a cross on the graph. For example, the following plot
illustrates that assuming a higher phenocopy rate (neg risk) or a
higher risk for variant carriers (het/hom risk) would quickly decrease
cosegregation evidence from the 16–32 to the 8–16 range.
Sensitivity analyses may take some time to complete, but progress bars will keep you informed of their status.